The impetus for writing this book came from the lessons I’ve learned from
using and teaching geographic information systems (GIS) for over 10 years
at several different universities. One of these lessons is that “a little bit of
code can go a long way.”
Those of us who learned our first computer skills back in the days of
MS-DOS became familiar with using a command prompt to carry out basic
tasks. Early versions of ArcGIS for Desktop Advanced (ArcInfo) software
also relied heavily on a command line interface, in addition to the use of
the ARC Macro Language (AML).
Introduction to Representing, Modeling, and Visualizing the Natural Environment
Geographic information systems (GIS) provide a range of opportunities for exploring the complexity of the natural environment, offering tools and software packages that undergo continual innovation and development in response to new analytical demands for solutions to spatial problems. Geographic information science (GIScience) provides the academic framework for these technologies, addressing the theoretical and scientific issues associated with the use of GIS
.
The Handbook is written for academics, researchers, practitioners and advanced graduate students. It has been designed to be read by those new or starting out in the field of spatial analysis as well as by those who are already familiar with the field.
The chapters have been written in such a way that readers who are new to the field will gain important overview and insight. At the same time, those readers who are already practitioners in the field will gain through the advanced and/or updated tools and new materials and state-of-the-art developments included.
Advances in the field of geospatial technologies have resulted in the growth in the application of such methods and techniques to a wider range of challenges and issues associated with urban water resources. The use of remote sensing, geographic information science (GIS), spatial analysis, global positioning systems (GPS),
digital mapping, online electronic data resources, and processing techniques are now common tools in addressing urban water quality, storm water, flooding, water supply issues, and overall management of water resources and watersheds in urban communities and urbanizing landscapes. In this volume, the authors address many of the complex concerns and impacts associated with human and natural changes
facing urban water resources through their use of a variety of geospatial techniques and tools. The aim of the volume is to present the reader a mix of examples of the evolving use of geospatial methods and applications now utilized in many urban areas to assist decision-makers, planners, and communities in making sound judgments as to how best manage their water resources for both human use and to minimize impacts to the natural environment.
Although the concepts of GIS have remained fairly constant over time, the software is continually
evolving. With the release of ArcGIS Pro, the latest software in the Esri GIS family, a new generation of GIS has arrived. ArcGIS Pro has a 64-bit, multithreaded architecture, uses ribbon-style menus, integrates 2D and 3D applications, and is closely tied to ArcGIS Online.
Normalized Difference Vegetation Index (NDVI) is used to quantify vegetation greenness and is useful in understanding vegetation density and assessing changes in plant health. NDVI is calculated as a ratio between the red (R) and near infrared (NIR) values in traditional fashion:
NDVI is calculated in accordance with the following
generalized formula:
NDVI=(NIR-RED)/(NIR+RED)
Where NIR - reflection in the near-infrared spectrum and RED - reflection in the red range of the spectrum.
NDVI values range from -1.0 to 1.0 representing greens, where negative values are mainly formed from clouds, water and snow, and values close to zero are primarily formed from rocks and bare soil.
Very small values (0.1 or less) of the NDVI function correspond to empty areas of rocks, sand or snow.
Moderate values (from 0.2 to 0.3) represent shrubs and meadows, while large values (from 0.6 to 0.8) indicate temperate and tropical forests.
NDVI is a measure of the state of plant health based on how the plant reflects light at certain frequencies (some waves are absorbed and others are reflected).
This book aims to provide a practical introduction to spatial analysis, by focusing on application rather than theory, and by drawing on a wide range of examples from both human and animal health, including vector-borne and infectious diseases and non-infectious conditions. This book provide worked examples of the principal methodologies, using mainly the same disease data set throughout, which allows for direct comparison of the various techniques and helps to demonstrate their comparative strengths and weaknesses.
WETLAND AND WATER RESOURCE MODELING AND ASSESSMENT A Watershed Perspective
Preface: Toward a Watershed Perspective
This is a book about the methods and geospatial techniques for modeling and assessing wetlands and water resources at the watershed scale.The theme of the book, wetland and water resource modeling and assessment, is an active field of research that constantly undergoes theoretical and technical innovations. This book emphasizes a watershed perspective in the modeling and assessment areas.
A geographic information system (GIS) is a computer system for storing, managing, analyzing, and displaying geospatial data. Since the 1970s GIS has been important for professionals in natural resource management, land use planning, natural hazards, transportation, health care, public services, market area analysis, and urban planning. It has also become a necessary tool for government agencies of all levels for routine operations. The more recent integration of GIS with the Internet, a global positioning system (GPS), wireless technology, and Web service has found applications in location-based services, Web mapping, in-vehicle navigation systems, collaborative Web mapping, and volunteered geographic information.
Learning Geospatial Analysis with Python: Understand GIS fundamentals and perform remote sensing data analysis using Python 3.7
This book is for Python developers, researchers, or analysts who want to perform geospatial modeling and GIS analysis with Python. Basic knowledge of digital mapping and analysis using Python or other scripting languages will be helpful.
GIS Tutorial 1: Basic Workbook is the direct result of the authors' experiences
teaching GIS to high school students in a summer program at Carnegie Mellon
University, undergraduate and graduate students in several departments and
disciplines at Carnegie Mellon University, as well as working professionals.
GIS Tutorial 1 is a hands-on workbook with step-by-step exercises that take the
reader from the basics of using ArcGlS Desktop interfaces through performing
advanced spatial analyses.
Instructors can use this book for the lab portion of a GIS course, or individuals
can use it for self-study. You can learn a lot about GIS concepts and principles
by "doing" and we provide many short notes on a "just-in-time" basis to help
this kind of learning.
GIS, or geographic information systems, are computer-based equipment used to store, visualize, analyze, and interpret geographic data. Geographic data (also referred to as spatial, or geospatial data) identifies the geographic location of features.
These records consist of anything that can be associated with a region on the globe, or more in reality whatever that can be mapped. For example, roads, country boundaries, and tackle are all types of spatial data. A geographic Information system (GIS) lets in you to observe and explore everythingabout a place.


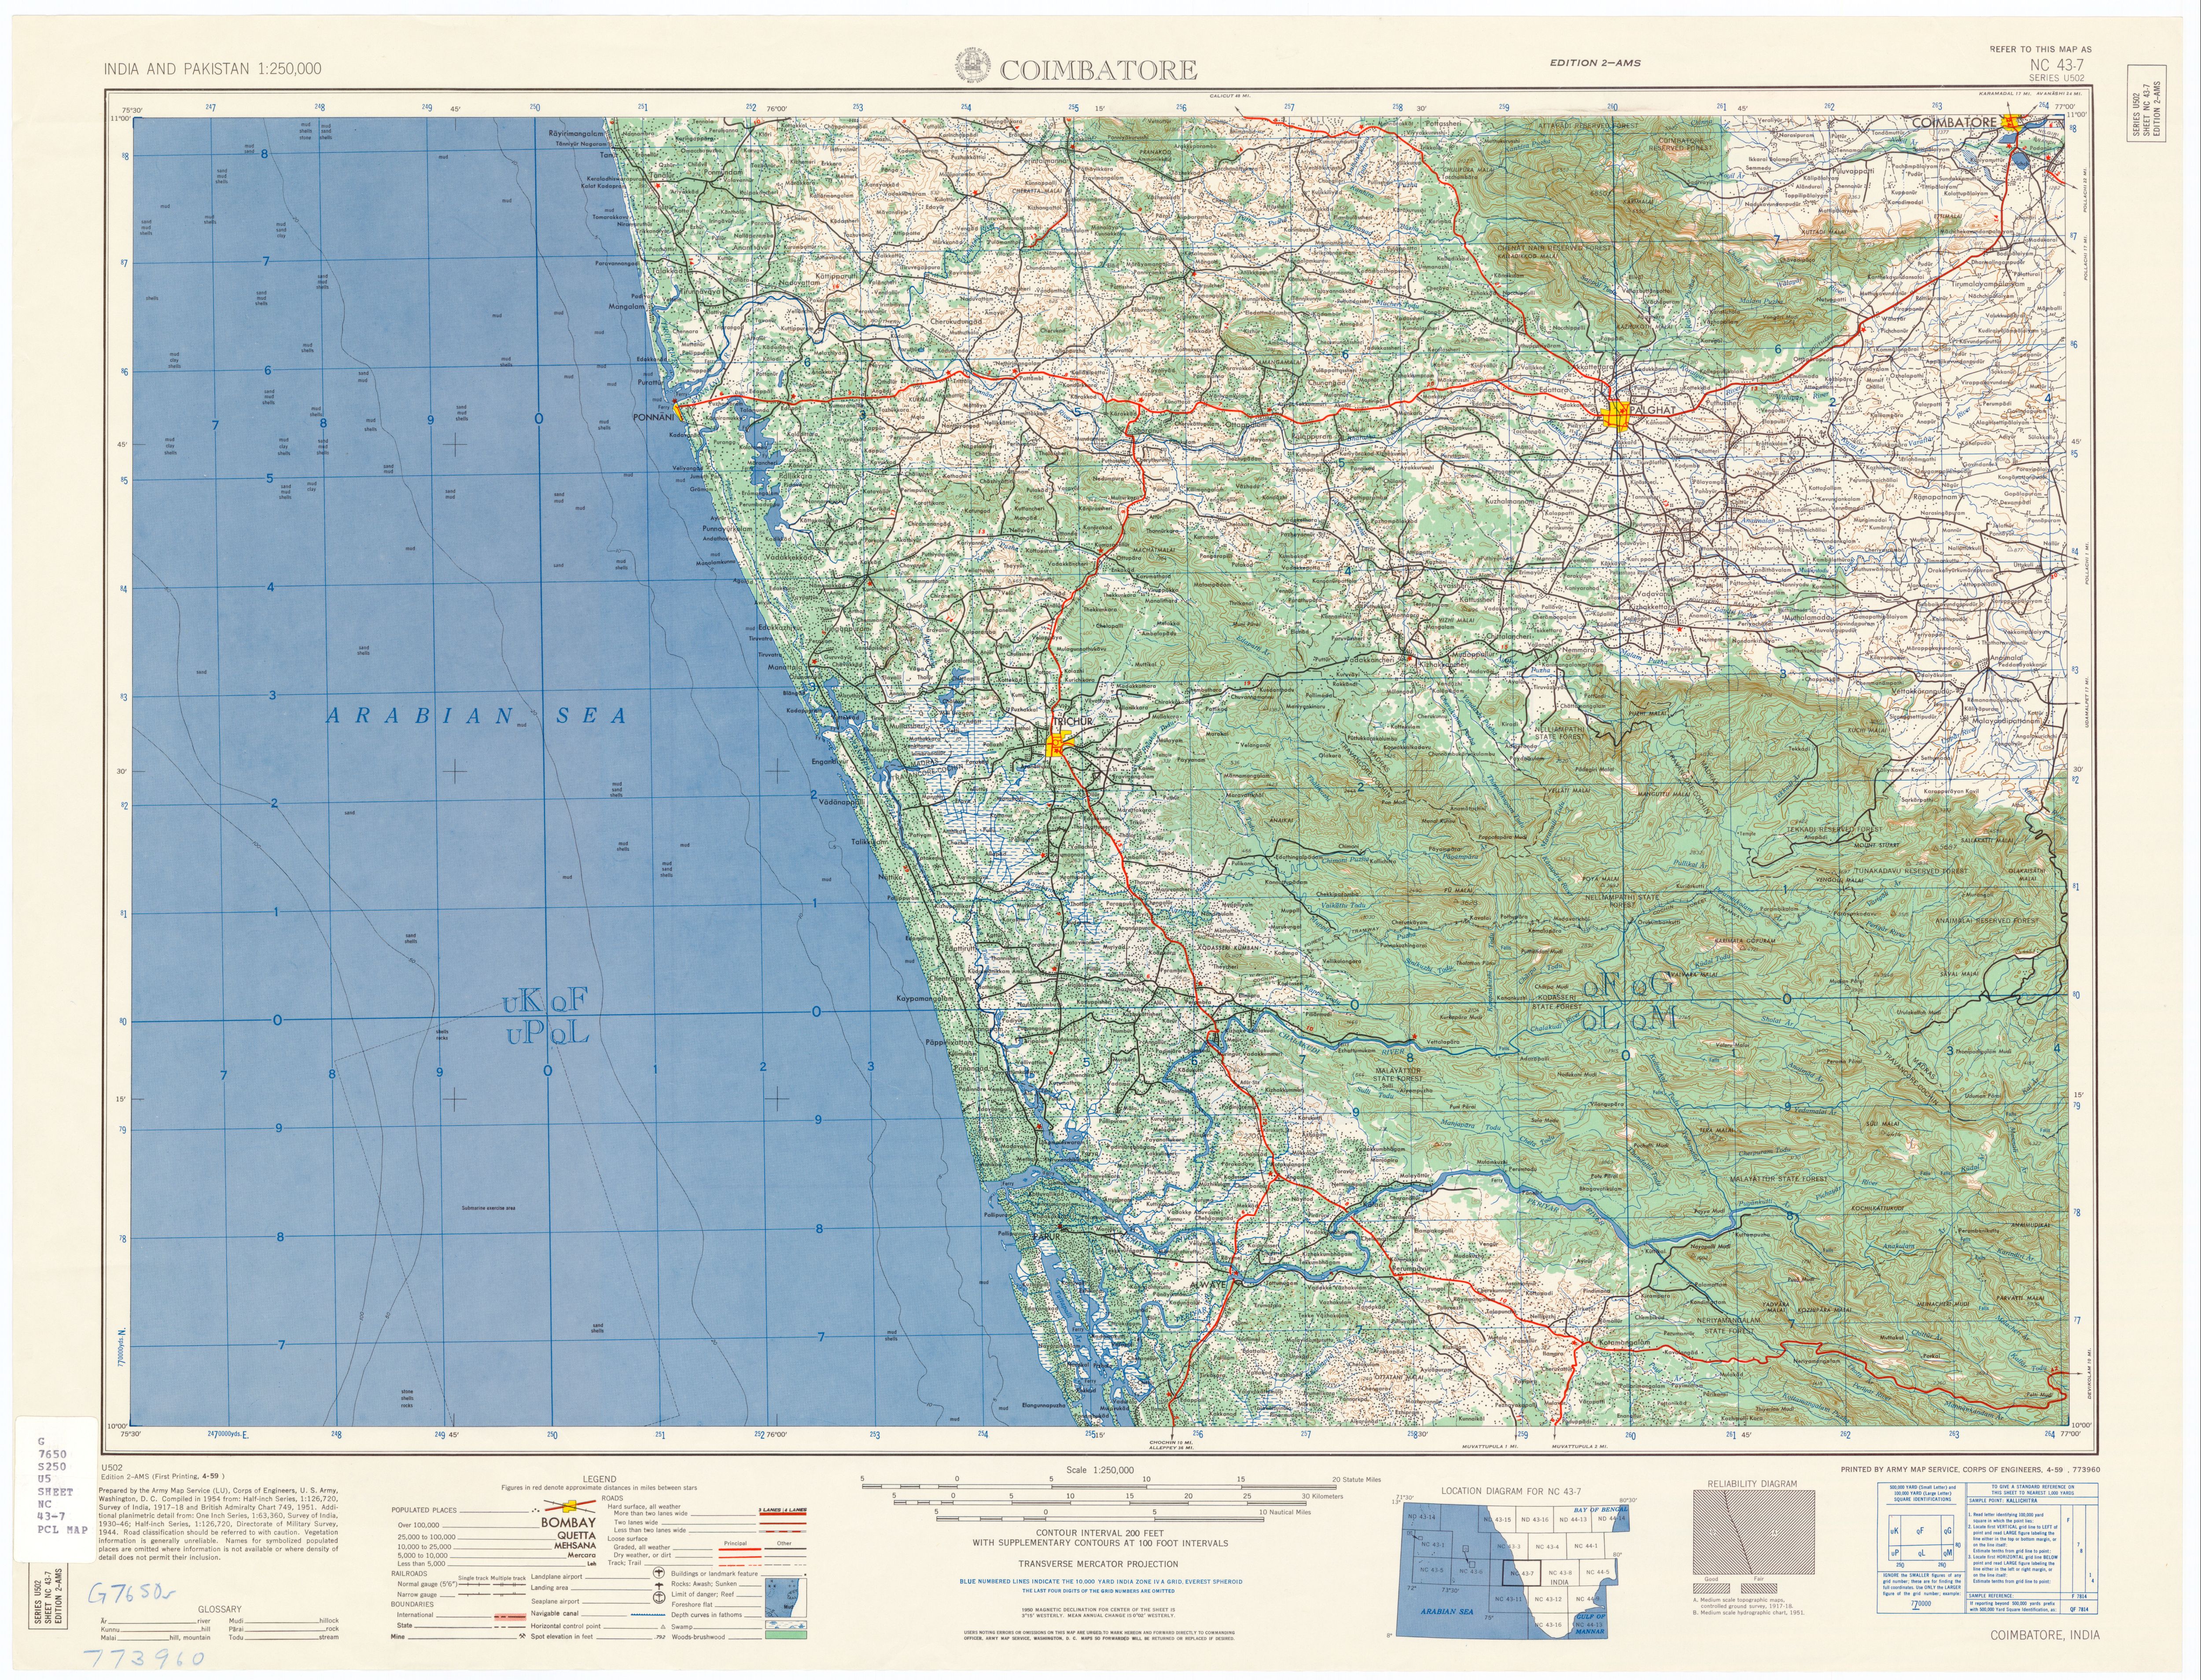
![NC 43-7 Coimbatore and Vicinity [verso]](http://legacy.lib.utexas.edu/maps/ams/india/nc-43-07b.jpg)
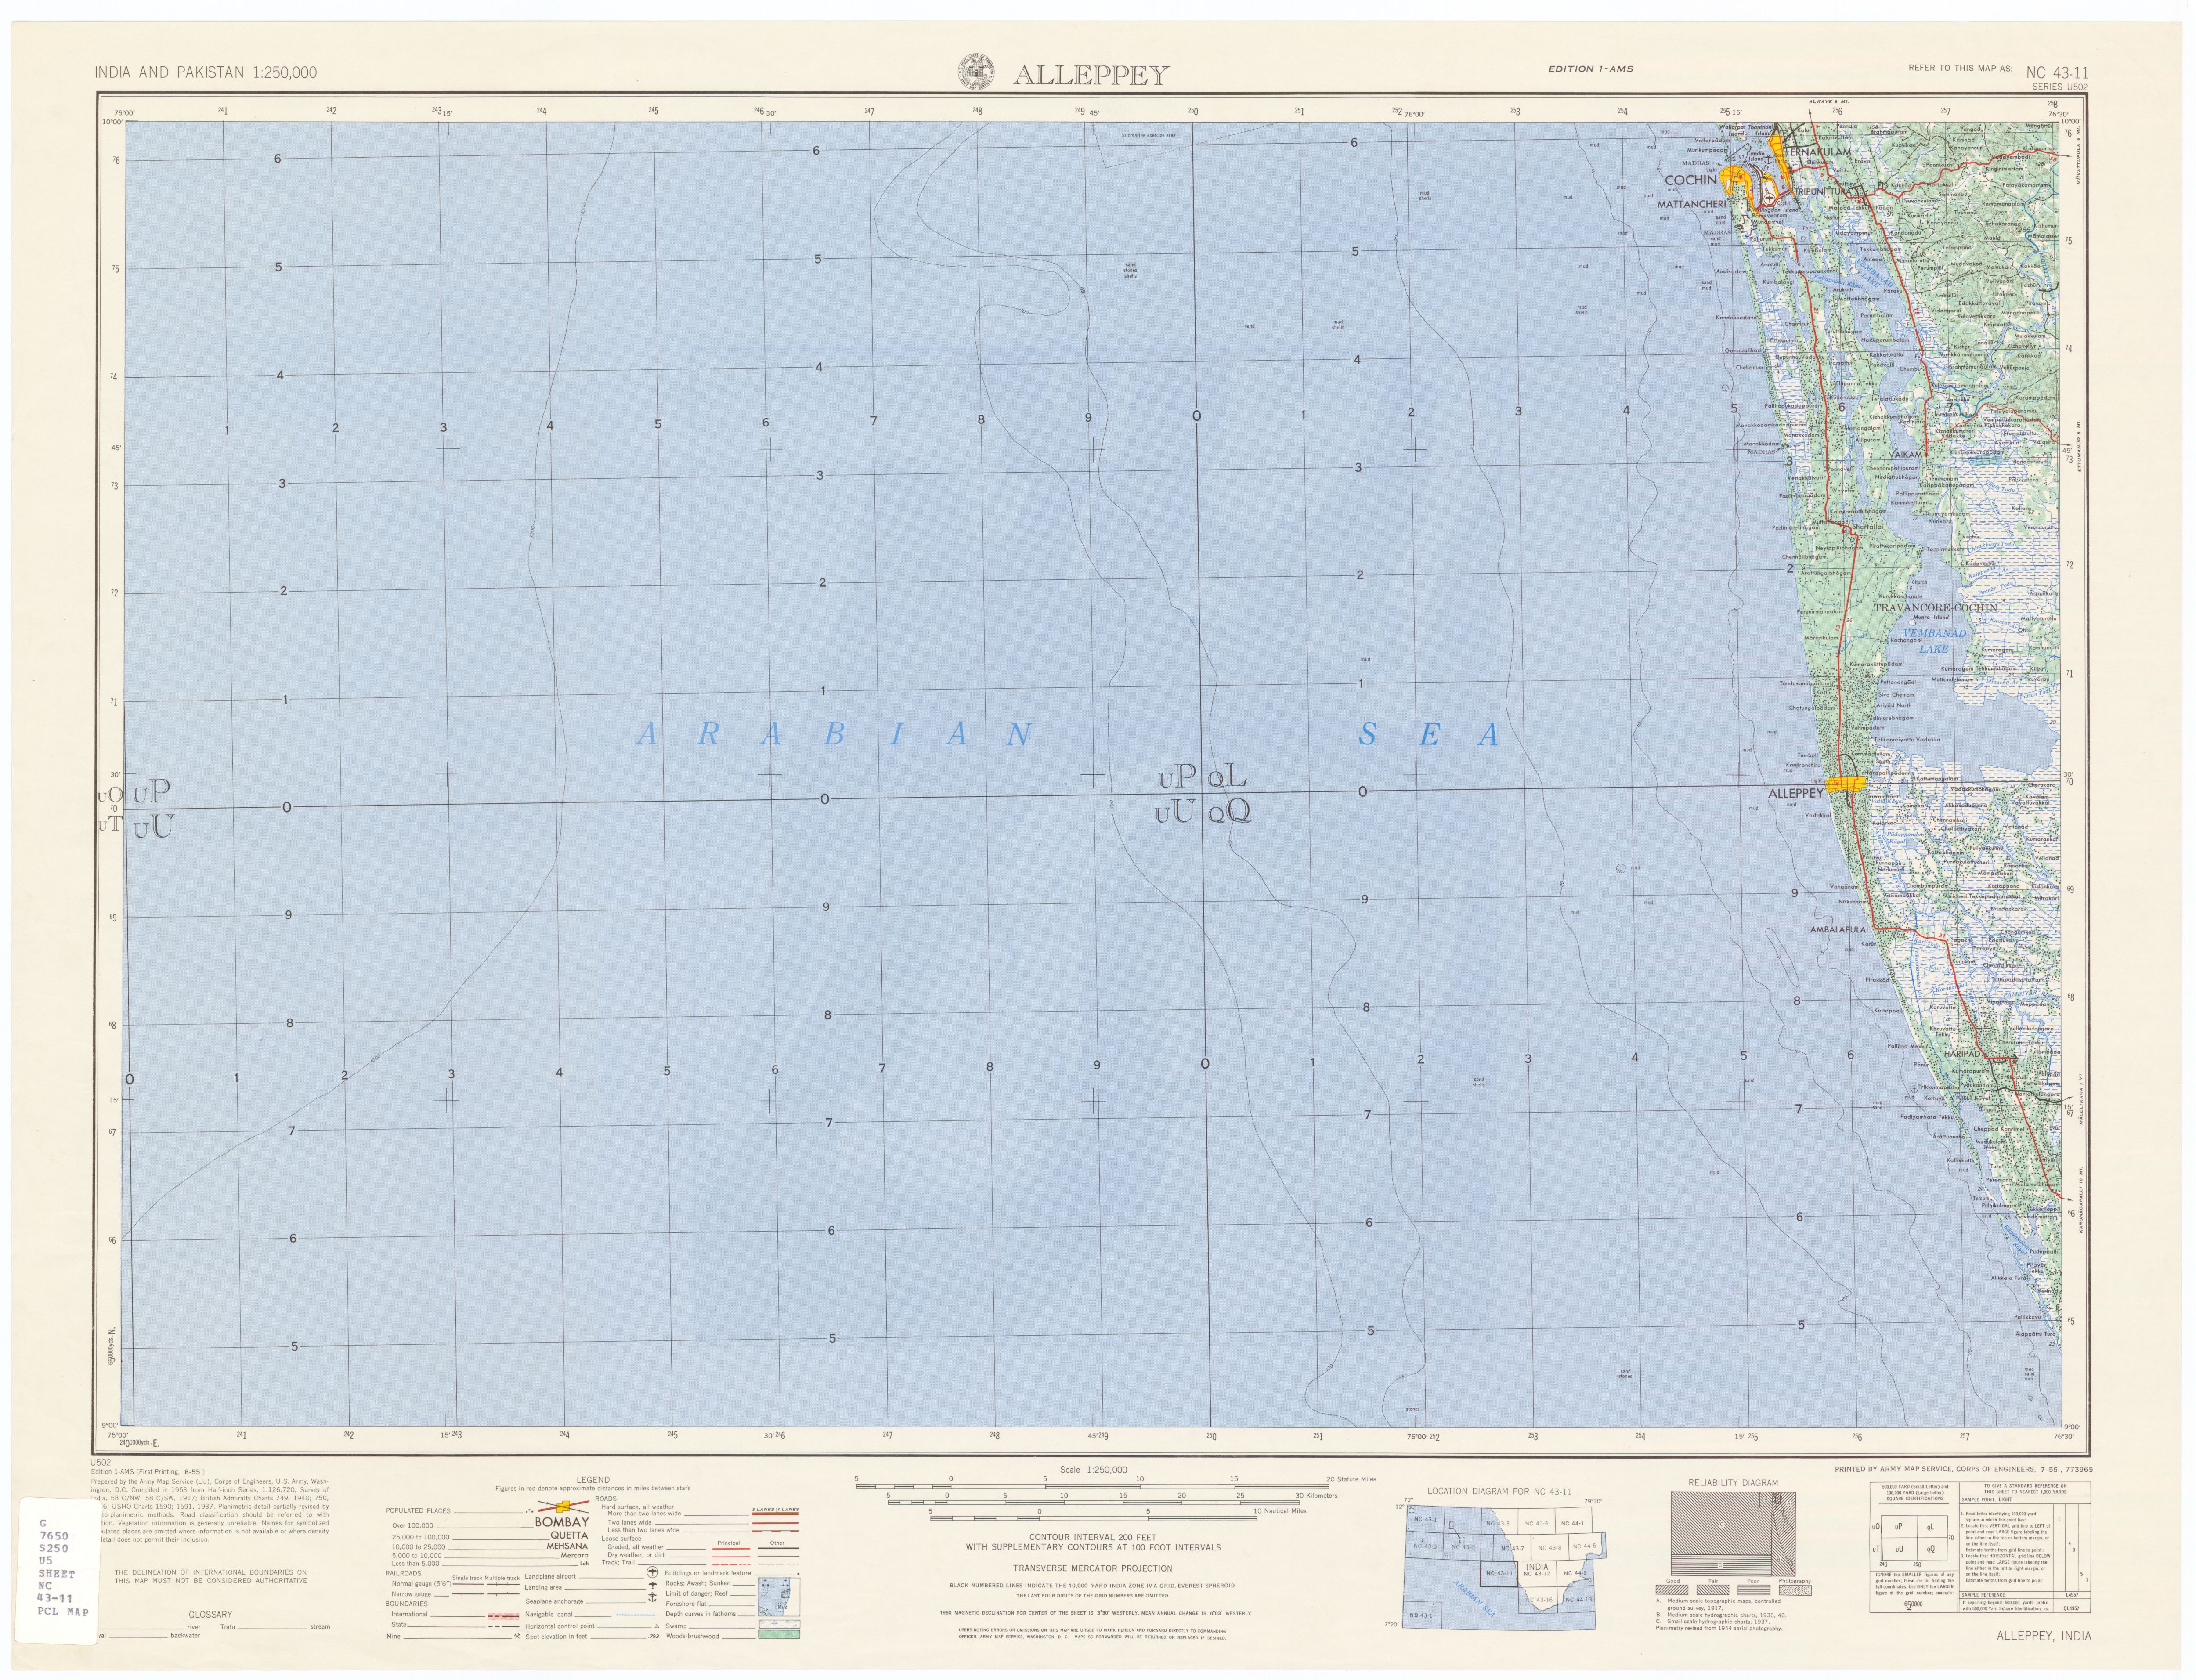
![NC 43-11 Cochin, Ernakulam and Vicinity [verso]](http://legacy.lib.utexas.edu/maps/ams/india/nc-43-11b.jpg)
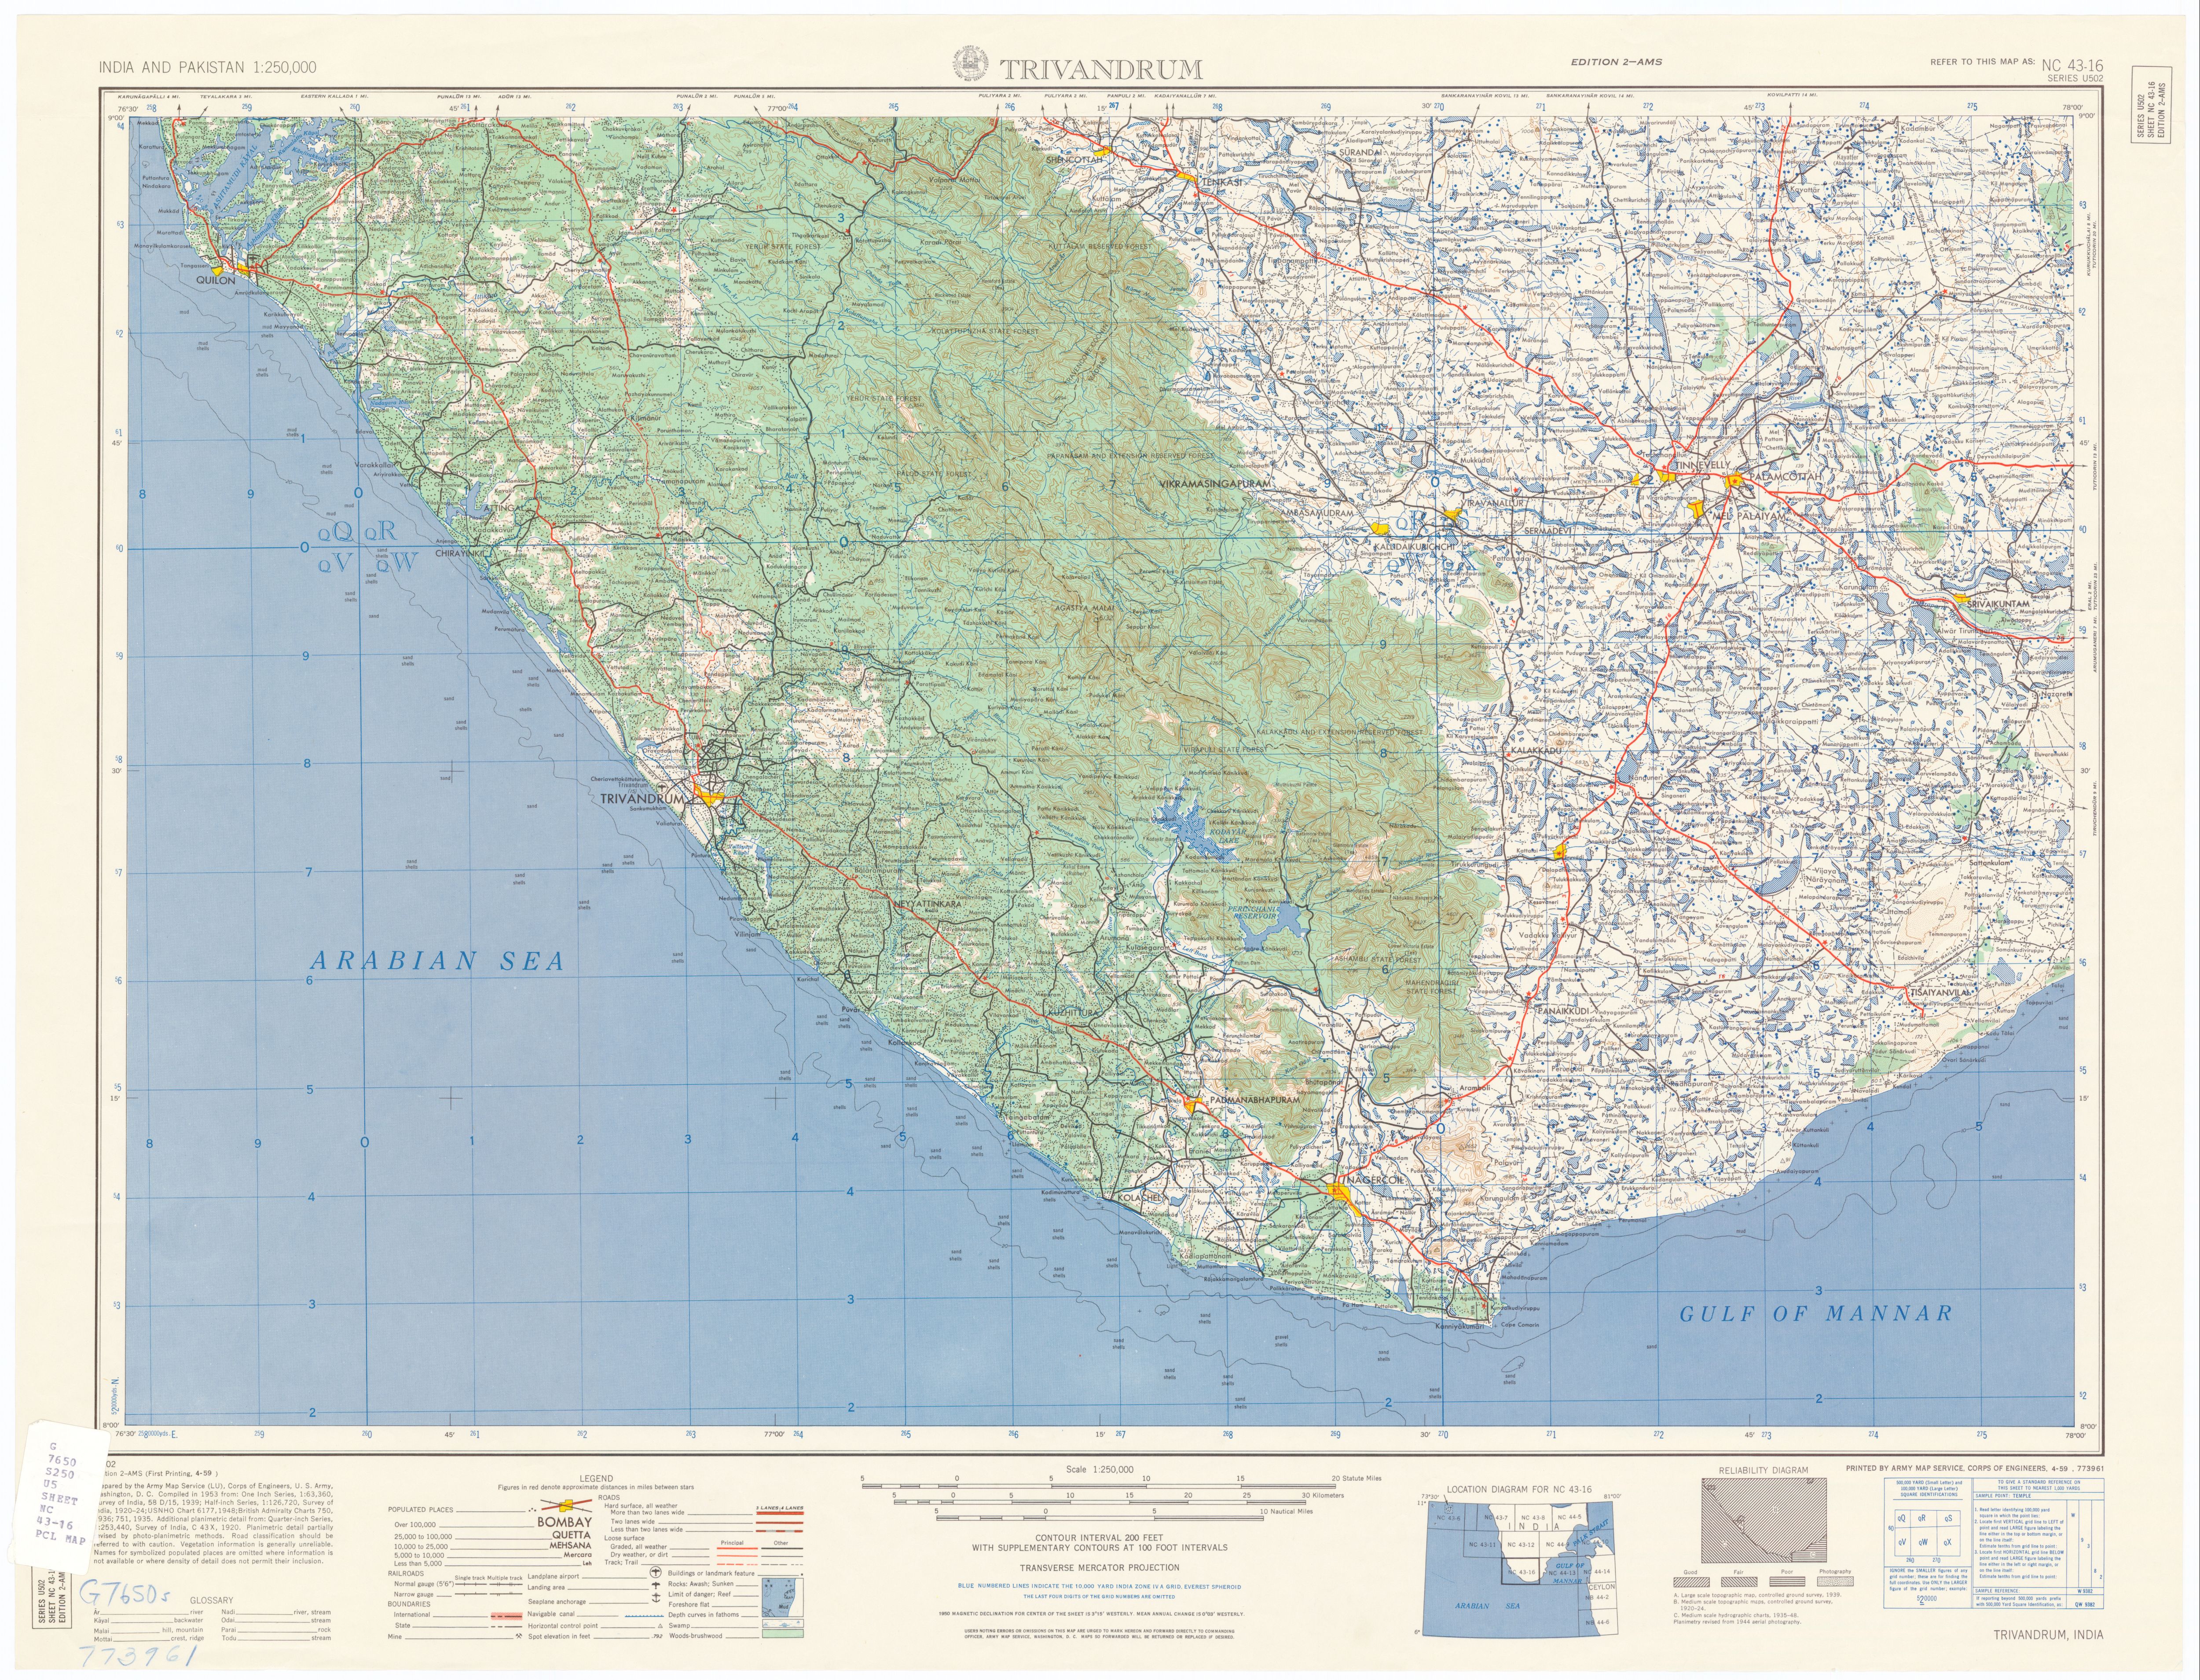
![NC 43-16 Trivandrum and Vicinity [verso]](http://legacy.lib.utexas.edu/maps/ams/india/nc-43-16b.jpg)
![NC 44-5 Tiruchirappalli and Vicinity; Tanjore and Vicinity [verso]](http://legacy.lib.utexas.edu/maps/ams/india/nc-44-05b.jpg)